International trade has contributed immensely to the rise in welfare since the end of WWII. Global trade is facilitated through worldwide transport networks. These networks are the catalysts for production linkages that allow for a more efficient allocation of resources through exploitation of comparative advantage and economies of scale.
However, the same transport networks are also responsible for the transmission of diseases. Over the last 300 years, ten major influenza pandemics have occurred – not counting COVID-19. The 1918 Spanish flu pandemic is considered the most severe to date: around 30% of the world’s population became ill and 40–50 million people died (Aassve et al. 2020). One important reason the Spanish flu was so much more deadly than previous pandemics was its quick and extensive spread, enabled by the global transport system (e.g. Rodrigue et al. 2020). The virus spread around the world through infected crew and passengers on ships and trains.
Recognising that transportation is an important vector of transmission, it comes as no surprise that as COVID-19 hit, the sector was one of the first to face significant restrictions. Needless to say, disruptions in the continuity of freight distribution will damage vital supply chains and add to the disruptions that the manufacturing sector is already experiencing (Baldwin and Tomiura 2020).
In a newly published analysis (Heiland and Ulltveit-Moe 2020) we take a closer look at seaborne transportation, which carries 80% of world merchandise trade. We use real-time satellite date to investigate what has happened so far to sailing routes and networks, and discuss the impact of the restrictions implemented in response to the outbreak of COVID-19.
The global shipping network
The global shipping network carries the majority of internationally traded goods. In a recent study (Heiland et al. 2019), we use satellite data on container ships (Cosar and Demir 2017) to establish a set of key facts about the transportation network. First, we show that container trade is highly concentrated on a small set of routes. Only 6% of all countries with container ports entertain direct shipping connections. All other countries’ shipping connections involve a stop in at least one other country. Second, a few central ports acting as hubs in the sparse network handle huge chunks of global seaborne trade, originating from and destined to countries all over the world.
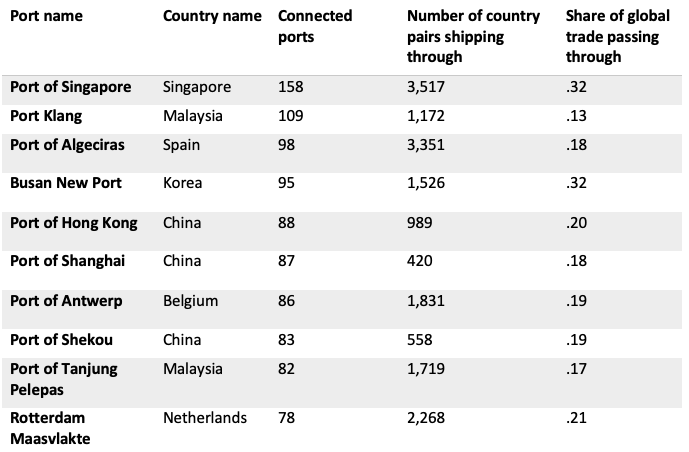
Table 1 provides an overview of the ten most central ports in the world. Column 4 shows that for 3,517 trade relationships (a pair of one exporter and one importer located anywhere on the globe) the fastest connection within the network of active shipping routes passes through the Port of Singapore. Trade between these countries accounts for 32% of global trade (Column 5).
Table 1 Top 10 ports in terms of direct connections and their importance for global trade

Source: Authors’ calculations
The upshot of all this is straightforward and important for world trade in the time of COVID-19. The negative effect of local COVID-19-related restrictions reach beyond the country imposing the restrictions and even beyond its direct trading partners, as disruptions are propagated through the network of interconnected shipping lines. The more central a port is in the shipping network, the more wide-ranging are the consequences of its restrictions for international trade. As we write in the week of 14 April 2020, all countries in the top-ten list had tightened the rules governing the mobility of sailors on incoming ships.
COVID-19 restrictions towards sea transport
Port restrictions imposed in response to the COVID-19 outbreak are typically related to whether the vessel’s previous port call was from a COVID-19 high-risk country, to crew who embarked from COVID-19 high-risk countries, and to crew changes and shore leave.
Changing crew is essential for a shipping company to comply with work contracts and labour regulation. In normal times, around 100,000 crew changes take place every month (Daniel 2020). Currently, however, 120 of 126 countries have implemented restrictions on crew change: in 92 countries crew change is prohibited, while in 28 countries crew change is subject to screening and approval from the authorities (Inchcape Shipping Services 2020).
Due to these restrictions, vessels have become ‘floating quarantined zones’, as countries refuse to allow ships to enter their ports until the crew has been declared virus-free. In most countries, the normal quarantine time is 14 days.1 On 16 April, there were 14,851 cargo ships on their way around the world. Only one-third of these ships were on voyages estimated to take 14 days or more. Hence, there is little doubt that port restrictions have a severe impact on transportation and supply chains.
What satellite data tell us about the impact of COVID-19 on sea transport
To complement the mounting anecdotal evidence on cancelled – blanked – sailings and disruptions to the maritime transportation network, we use satellite data for ship traffic provided by the Norwegian Coastal Administration in real time to investigate the impact of the COVID-19 outbreak and the restrictions imposed to impede transmission.
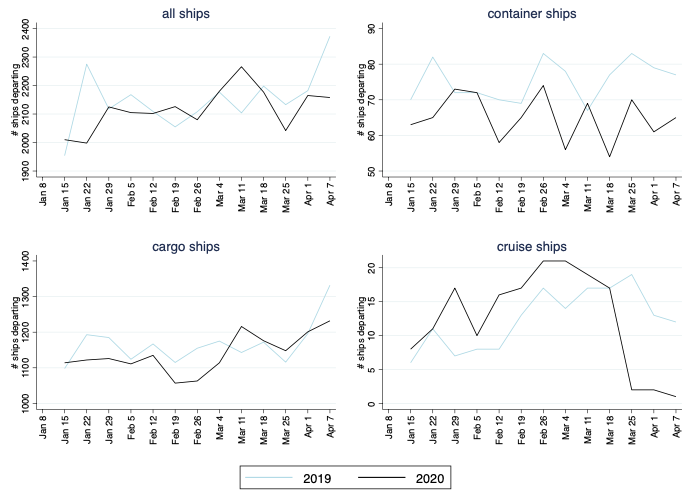
Figure 1 shows the number of weekly departures from Norwegian ports year-to-date (7 April)2 for 2019 and 2020 for all ships and three big market segments: container ships, other cargo ships, and cruise ships.
Figure 1 Weekly departures from Norwegian ports, 2020 vs 2019

Notes: The figures show the number of ships departing from Norwegian ports in the week ending with the date displayed on the horizontal axis. Cargo ships in the lower-left panel refer to non-containerised cargo ships.
Figure 1 shows the seasonality and volatility that is a general characteristic of shipping activity through the year. This is driven by external factors such as holidays, weather, and orders. However, we observe that the COVID-19 pandemic had a clear effect on sea transportation for all ship types. Focusing on cargo ships, sailings are down in 2020 already from the beginning of the year. This is most likely due to the outbreak in China and the shutdown of production that followed. As COVID-19 reached the western hemisphere and triggered lockdowns across the globe from mid-March, the picture becomes grimmer for container ships, carrying merchandise goods, and even more so for cruise ships.
In mid-April, after a few weeks of global lockdown, the cruise industry stands out with a dramatic fall, but sea transportation of cargo has also been substantially hit. The departure of all ships in the first week of April 2020 was down 20% compared to 2019, while the decrease in container-ship departures was 29%.
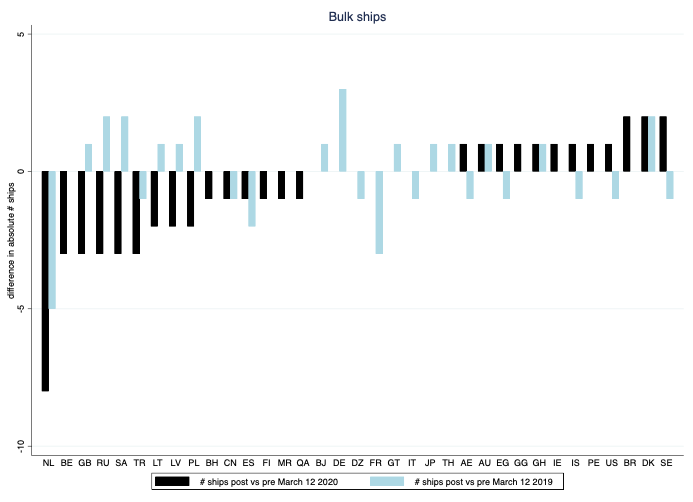
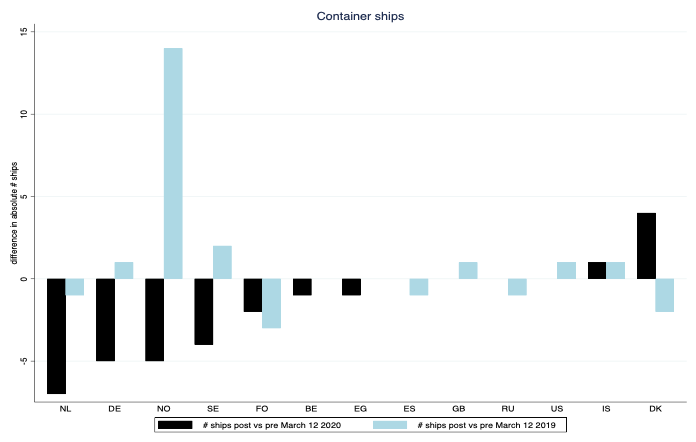
Next, we look at sailings by destination. Figures 2 and 3 illustrate the change in the number of sailings for bulk and container ships before and after 12 March 2020, which was the day the Norwegian government introduced tight restrictions on movement and activity. The date of the Norwegian lockdown coincides roughly with the dates a majority of western countries entered lockdown. We observe that for the majority of destinations, sailings are down after mid-March.
Figure 2 Change in departures of bulk ships post vs pre COVID-19 restrictions

Note: The pre (post) period spans 35 days prior to (starting on) March 12. Source: https://kystdatahuset.no/avganger-per-dag. Accessed 16/04/2020.
Figure 3 Change in departures of container ships post vs pre-COVID-19 restrictions

Note. The pre (post) period spans 35 days prior to (starting on) 12 March 2020. Source: https://kystdatahuset.no/avganger-per-dag. Accessed 16 April 2020.
To establish causality and filter out trends in shipping unrelated to the COVID-19 crisis, we conduct a difference-in-difference estimation. Comparing the change in the number of departures in the five weeks prior to and five weeks after 12 March across the years 2020, 2019, and 2018, we find that in 2020 the number of ships dropped by 6% compared to the change observed in previous years. For container ships, the difference is -8%; for cargo ships, the drop is 3%. Tanker traffic, which also suffers from the concurrent turbulences in the oil market, is down 16%.
Lastly, we analyse whether countries’ restrictions towards sea transportation are responsible for the decline in shipping activity using cross-country information on crew change restrictions (Inchcape Shipping Services 2020). The results are striking. For container ships, we find that sailings to destinations where crew changes are prohibited are down by almost 20% for container ships, as compared to a decline of 6% to destinations which have imposed milder restrictions, such as screening rules.
Concluding remarks
International trade and global production networks are heavily reliant on the smooth operation of maritime transport. As the world faces the COVID-19 pandemic, operations are anything but smooth.
Sea transport weathered many crises in the past. According to Stopford (2007), seaborne trade experienced deep but v-shaped contractions in all major economic crises. In the most recent global crisis of 2009, seaborne trade fell by 4.5% (UNCTAD 2011).
Is the current crisis different? It certainly is unprecedented in that it attacks the shipping industry on two fronts at the same time. Besides a steep contraction in demand, the industry is also faced with regulatory constraints disrupting its operations in almost all ports. The detrimental effects of local disruptions are multiplied as they spread through the network of interconnected shipping lines.
As pointed out by, among others, Bekkers et al. (2020), the outlook for international trade in 2020 is bleak. Our analysis shows that we need flexible port regulations based on screening and discretion in order to ensure the continuity of freight distribution and to secure that supply chains do not get a double hit.
References
Aassve, A, G Alfani, F Gandolfi and M Le Moglie (2020), “Pandemics and social capital: From the Spanish flu of 1918-19 to COVID-19”, VoxEU.org, 22 March.
Baldwin, R and E Tomiura (2020), “Thinking ahead about the impact of COVID-19”, in Baldwin, R and B Weder di Mauro (eds), Economics in the time of COVID-19, CEPR Press
Bekkers, E, A Keck, R Koopman and C Nee (2020), “Trade and COVID-19: The WTO’s 2020 and 2021 trade forecast”, VoxeEU.org, 24 April 24.
Cosar, K and B Demir (2017), “Containers and globalisation: Estimating the cost structure of maritime shipping”, VoxEU.org, 13 June.
Daniel, A (2020), “The ship must go on”, Windward, 26 March.
European Commission (2020), “Communication from the Commission: Guidelines on protection of health, repatriation and travel arrangements for seafarers, passengers and other persons on board ships”, C(2020) 3100 final.
Heiland, I, A Moxnes, K H Ulltveit-Moe and Y Zi (2019), “Trade from Space: Shipping networks and the global implications of local shocks”, CEPR Discussion Paper 14193.
Heiland, I and K H Ulltveit-Moe (2020): “An unintended crisis in sea transportation due to COVID-19 restrictions”, in Baldwin, R E and S J Evenett (eds), COVID-19 and Trade Policy: Why Turning Inward Won’t Work, CEPR Press
Inchcape Shipping Services (2020), “Coronavirus (COVID-19) port/country implications”.
International Maritime Organization (2020), “Coronavirus (COVID-19): Preliminary list of recommendations for Governments and relevant national authorities on the facilitation of maritime trade during the COVID-19 pandemic”, Circular Letter No. 4204/Add. 6, 27 March.
Rodrigue, J-P, and M Osterholm (2020), “Transportation and pandemics”, in J-P Rodrigue (ed.), The Geography of Transport Systems, New York: Routledge.
Stopford, M (2007), “Will the next 50 years be as chaotic in shipping as the last?”, paper presented at the Hong Kong Shipowners Association 50th Anniversary Analysts’ lunch, 18 January.
United Nations Conference on Trade and Development (2011), “Review of maritime transport 2010”.
Endnotes
1 Reported by CNN Business, London, 20 February 2020.
2 Week 15 starting on 8 April was dropped since it included the Easter holidays in 2020, but not in 2019.
Source: https://voxeu.org/article/covid-19-restrictions-hit-sea-transportation


